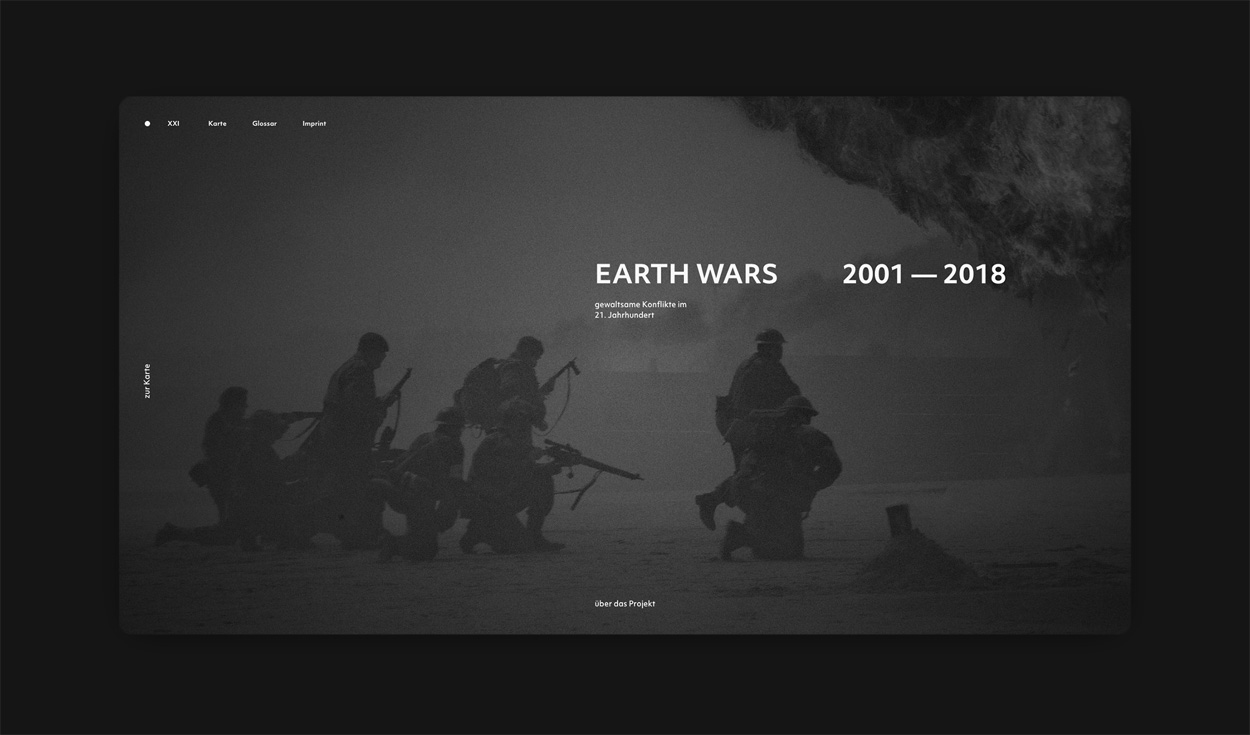
XXI — Earth Wars
violent conflicts in the 21st century
The aim of my bachelor thesis was to provide an overview of violent conflicts in the
21st century.
For this the main aspect of the project was laid on the development of a factual and objective type
of visualization that provides access to data and information
about the individual conflicts.
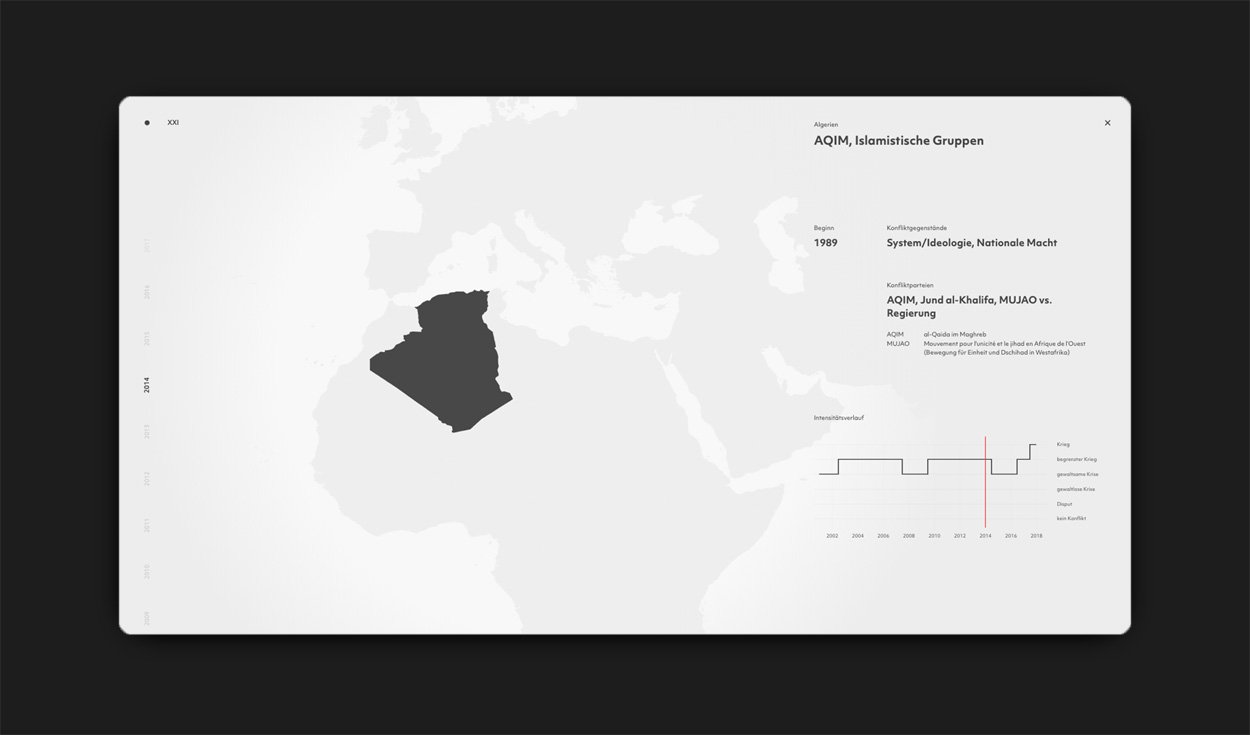
The result was an interactive map of political conflicts in the period of 2001 to 2018. The conflict
in detail is considered on the
basis of the course of intensity, the involved actors, as well as the underlaying items of the
conflicts.
The question of the aptitude of the means and forms of visualization for the
development and presentation of the data sets played a central role for design decisions.
Various geospatial visualization approaches have been developed for the interactive map, resulting
in a responsive and user-centered concept for a website and it's final development.
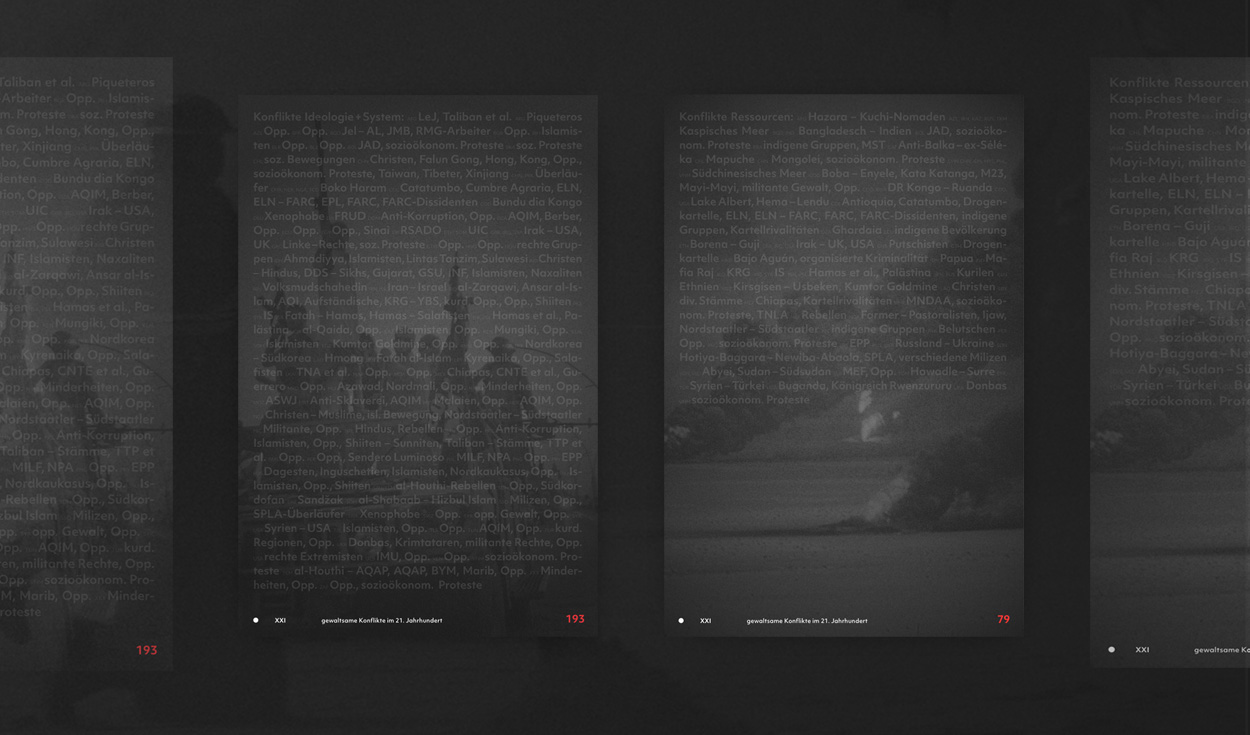
media: website, poster series
implementation: HTML5, CSS3, ES6 and d3.js
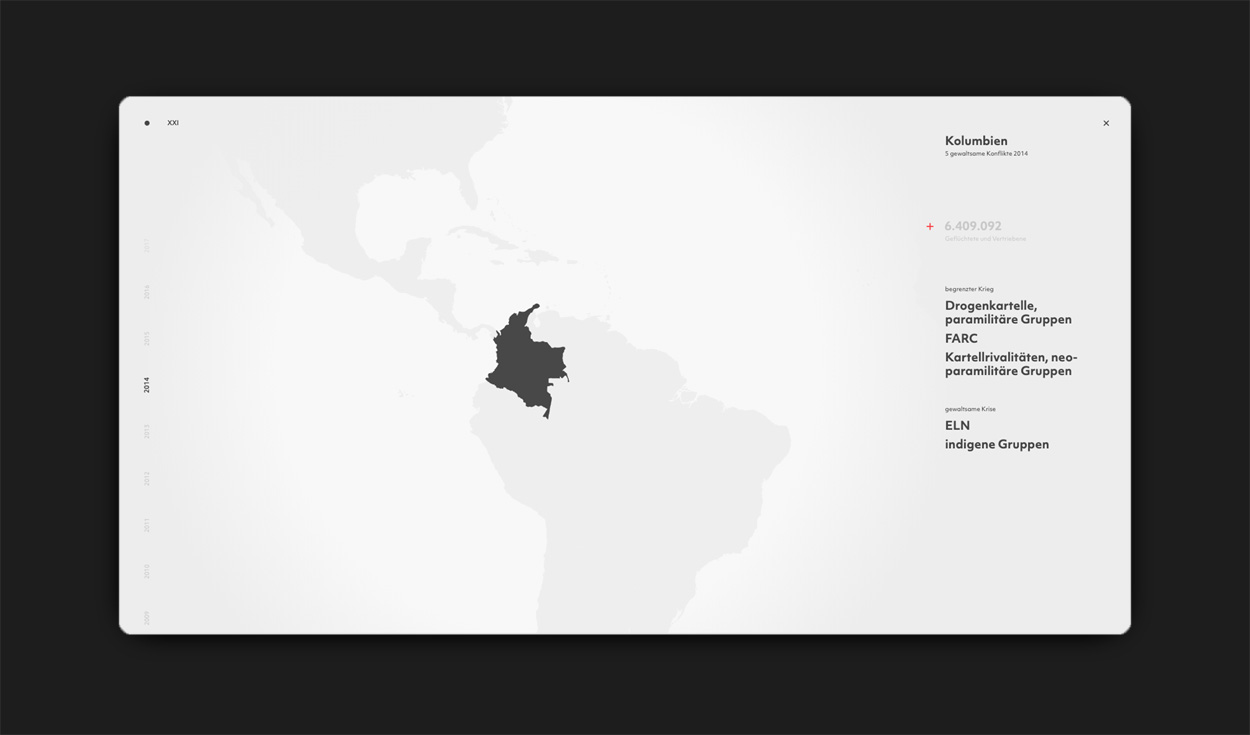
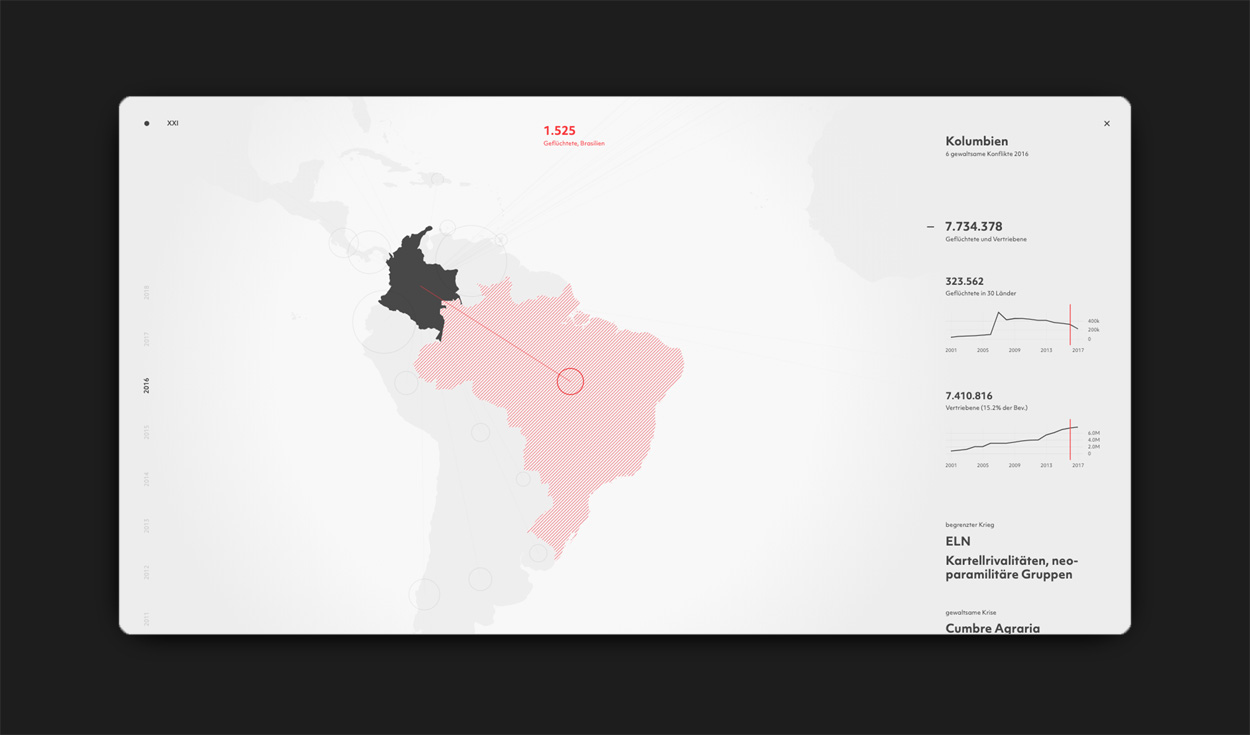
Conflicts always have different effects on different areas. In conflict research, these effects and consequences are generally included in the classification of the intensity of a conflict. These numbers, however, are bad and difficult to grasp. To get an idea of the effects on humans there are also shown the number of refugee movements and displaced persons at national level on the website. These numbers are not directly correlated to the individual conflicts, but may be indicative of the impacts and dimensions that the conflicts in the affected countries create.
The data visualization is generally based on the annual conflict barometer of the Heidelberg Institute for Interantional Conflict Research , the Uppsala Conflict Data Program and the refugee data of the UNHCR . Much of the work consisted of investigating on the current state of research, examining the existence of sources, the data analysis and preparation. From the information and data of the research, a data set was created with which the realization of a data-based visualization was possible.
supervision: Prof. Veruschka Götz, Stephan Ditgens
University of Applies Sciences Mannheim, SS19
other projects
-

Typo + Processing
Generative
-

komma 19
Editorial